ggpsychro creates psychrometric charts with the same additive grammar
used by ggplot2. Start with ggpsychro(), choose the chart
limits and units, and then add grids, scales, stats, geoms, and themes
with +.
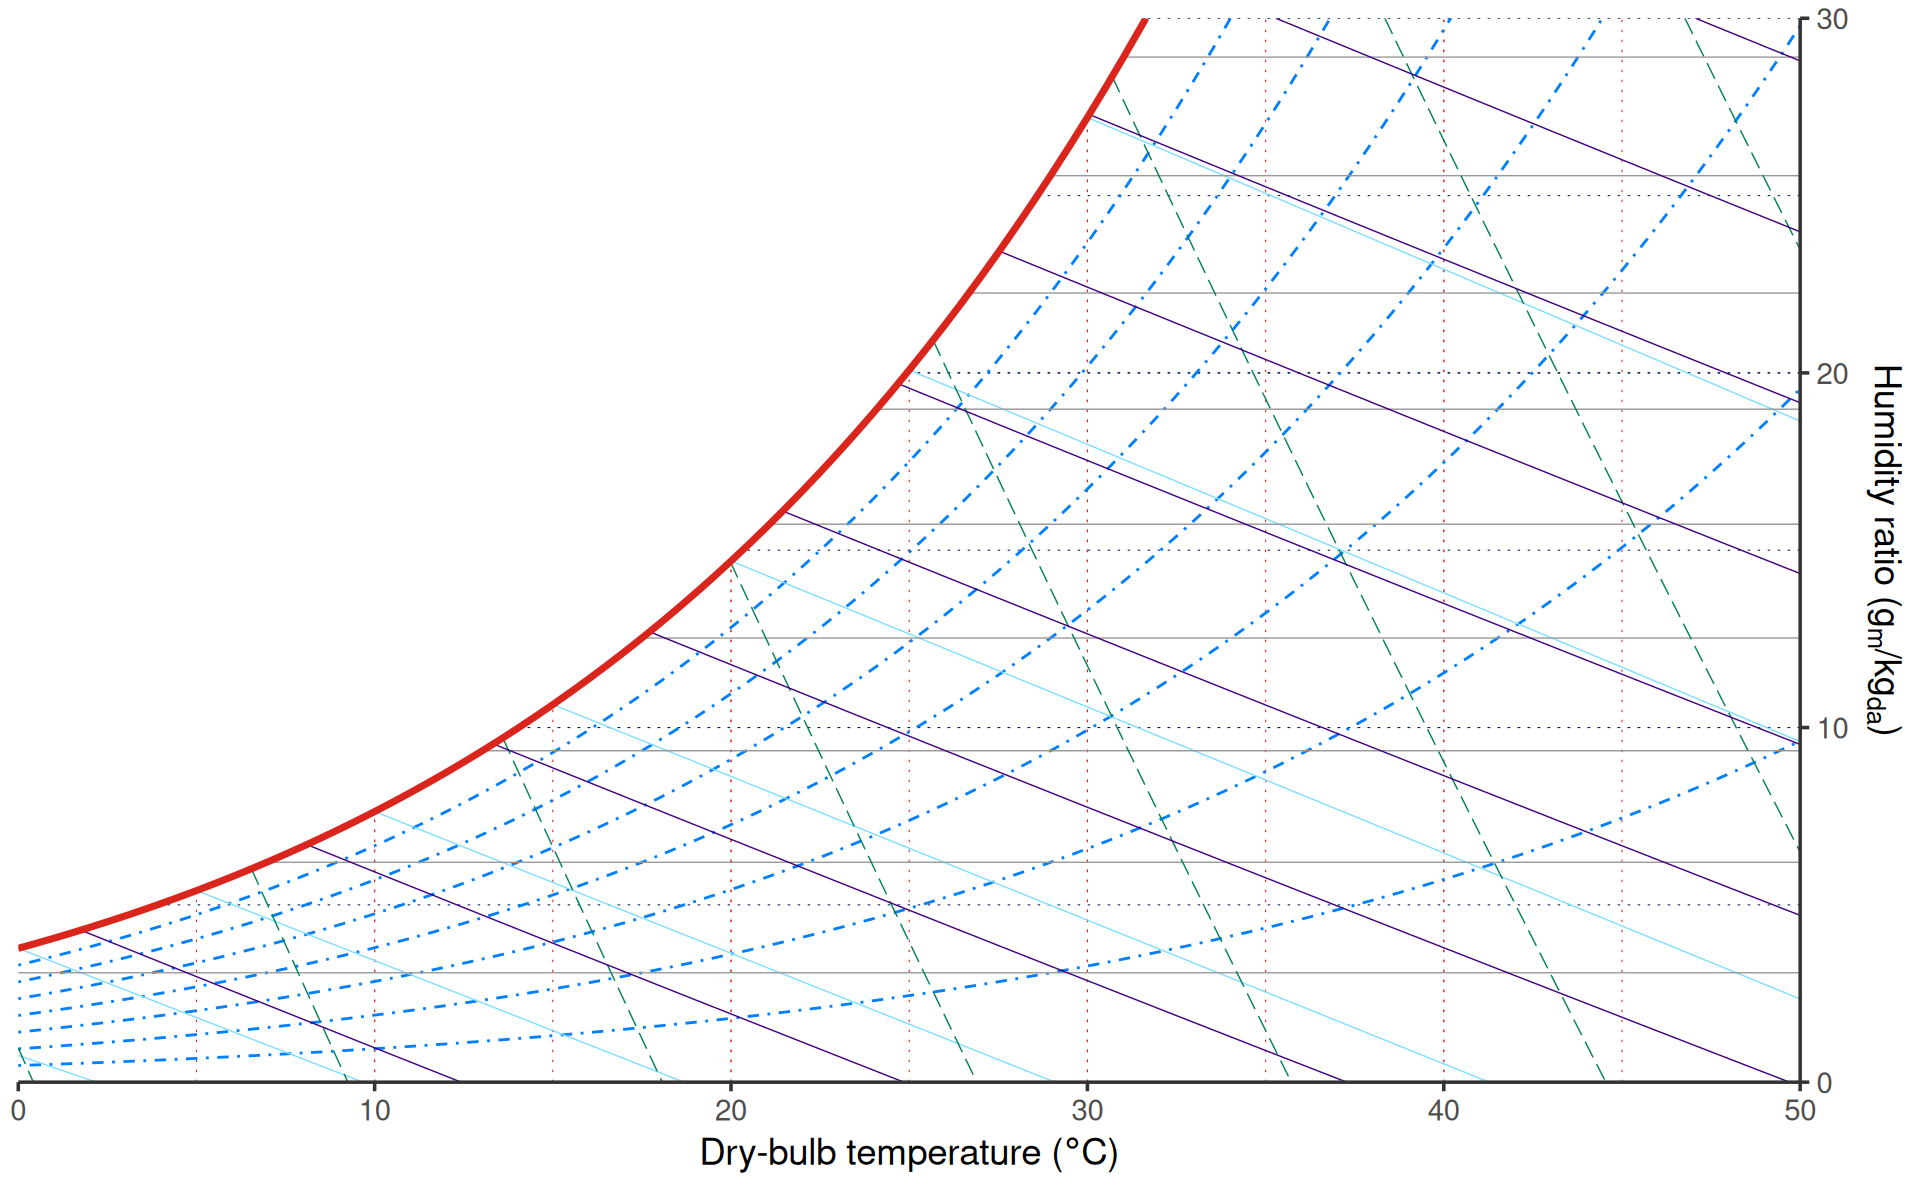
Chart limits and units
tdb_lim controls the dry-bulb temperature range.
hum_lim controls the displayed humidity ratio range. SI
units are used by default.

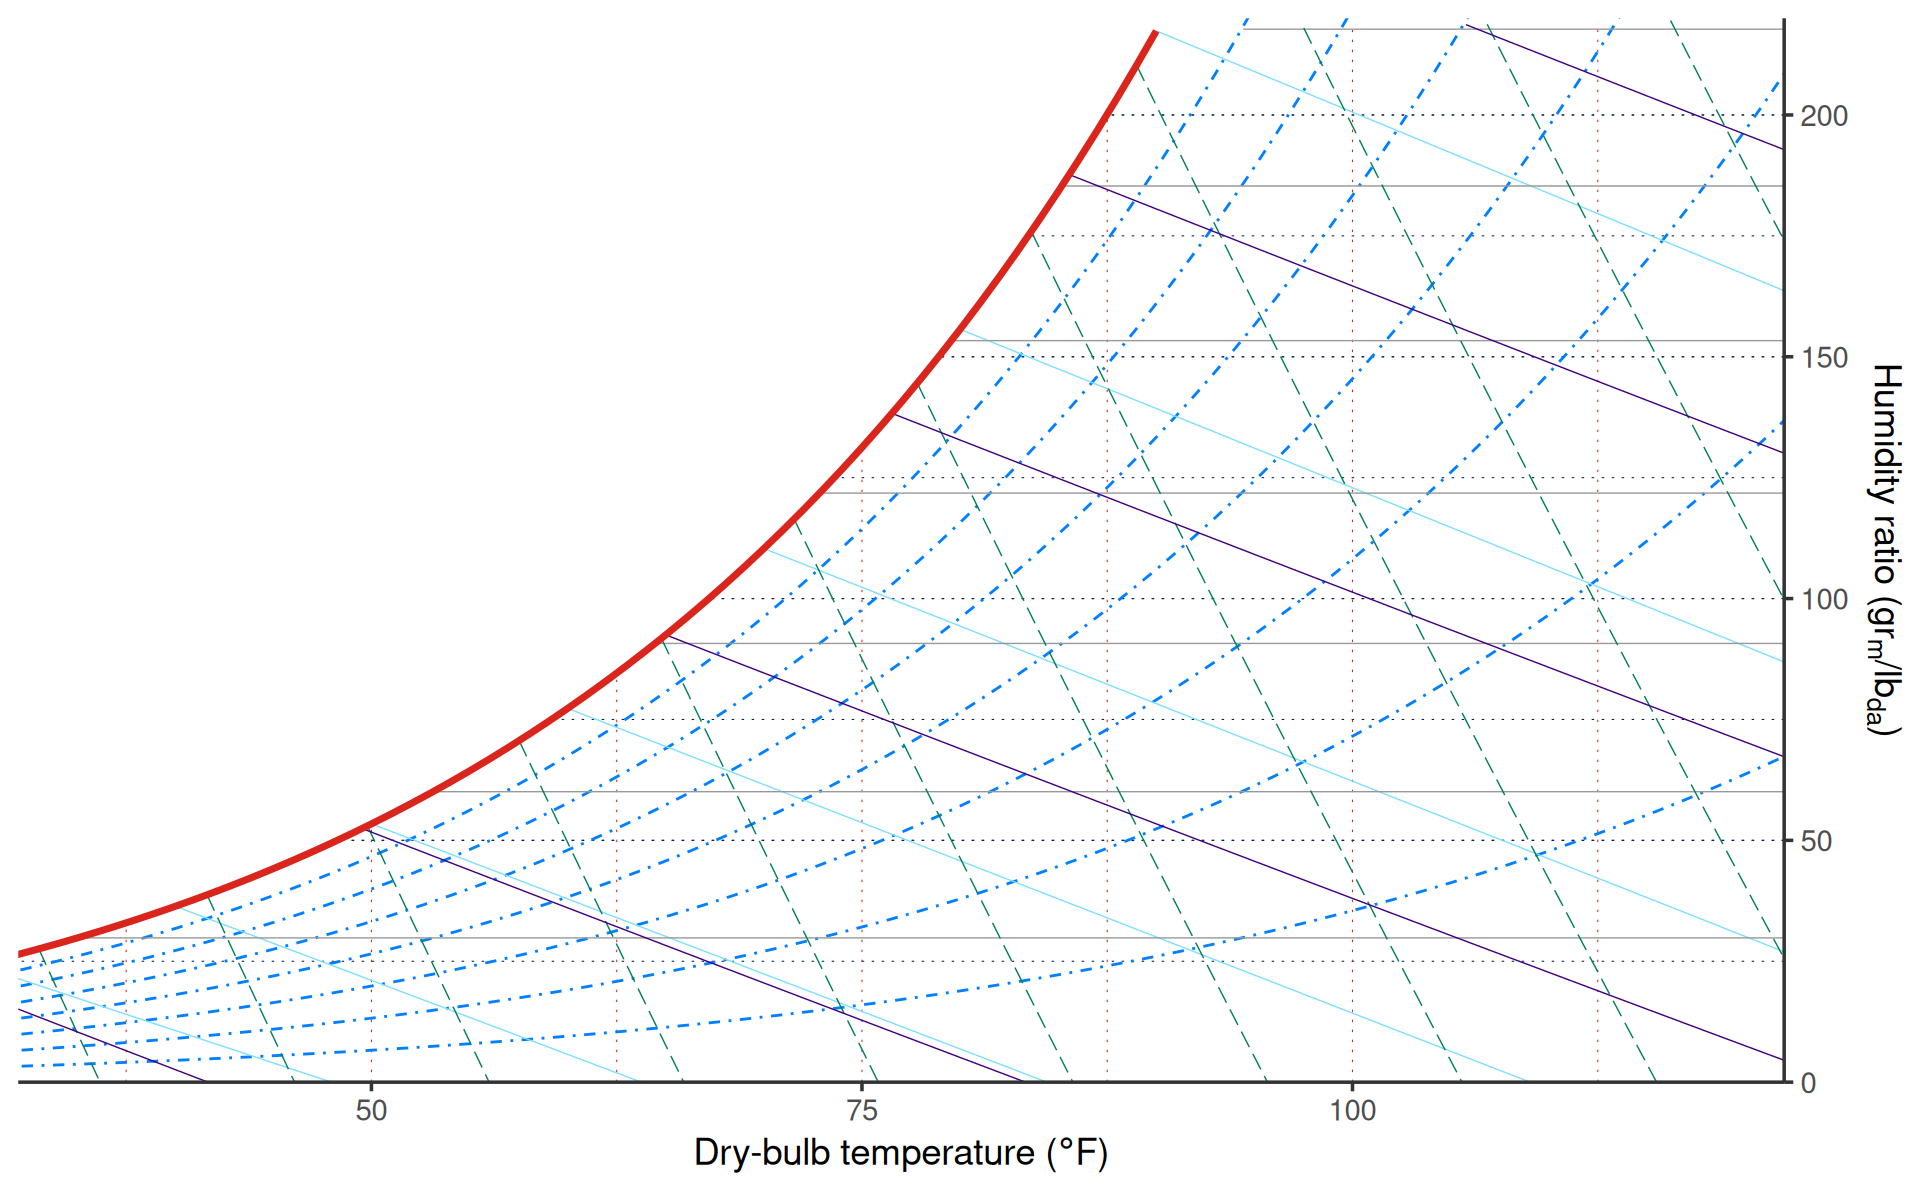
Use units = "IP" for IP charts. The dry-bulb limits are
in degree F and the humidity-ratio limits are in grains per pound of dry
air.
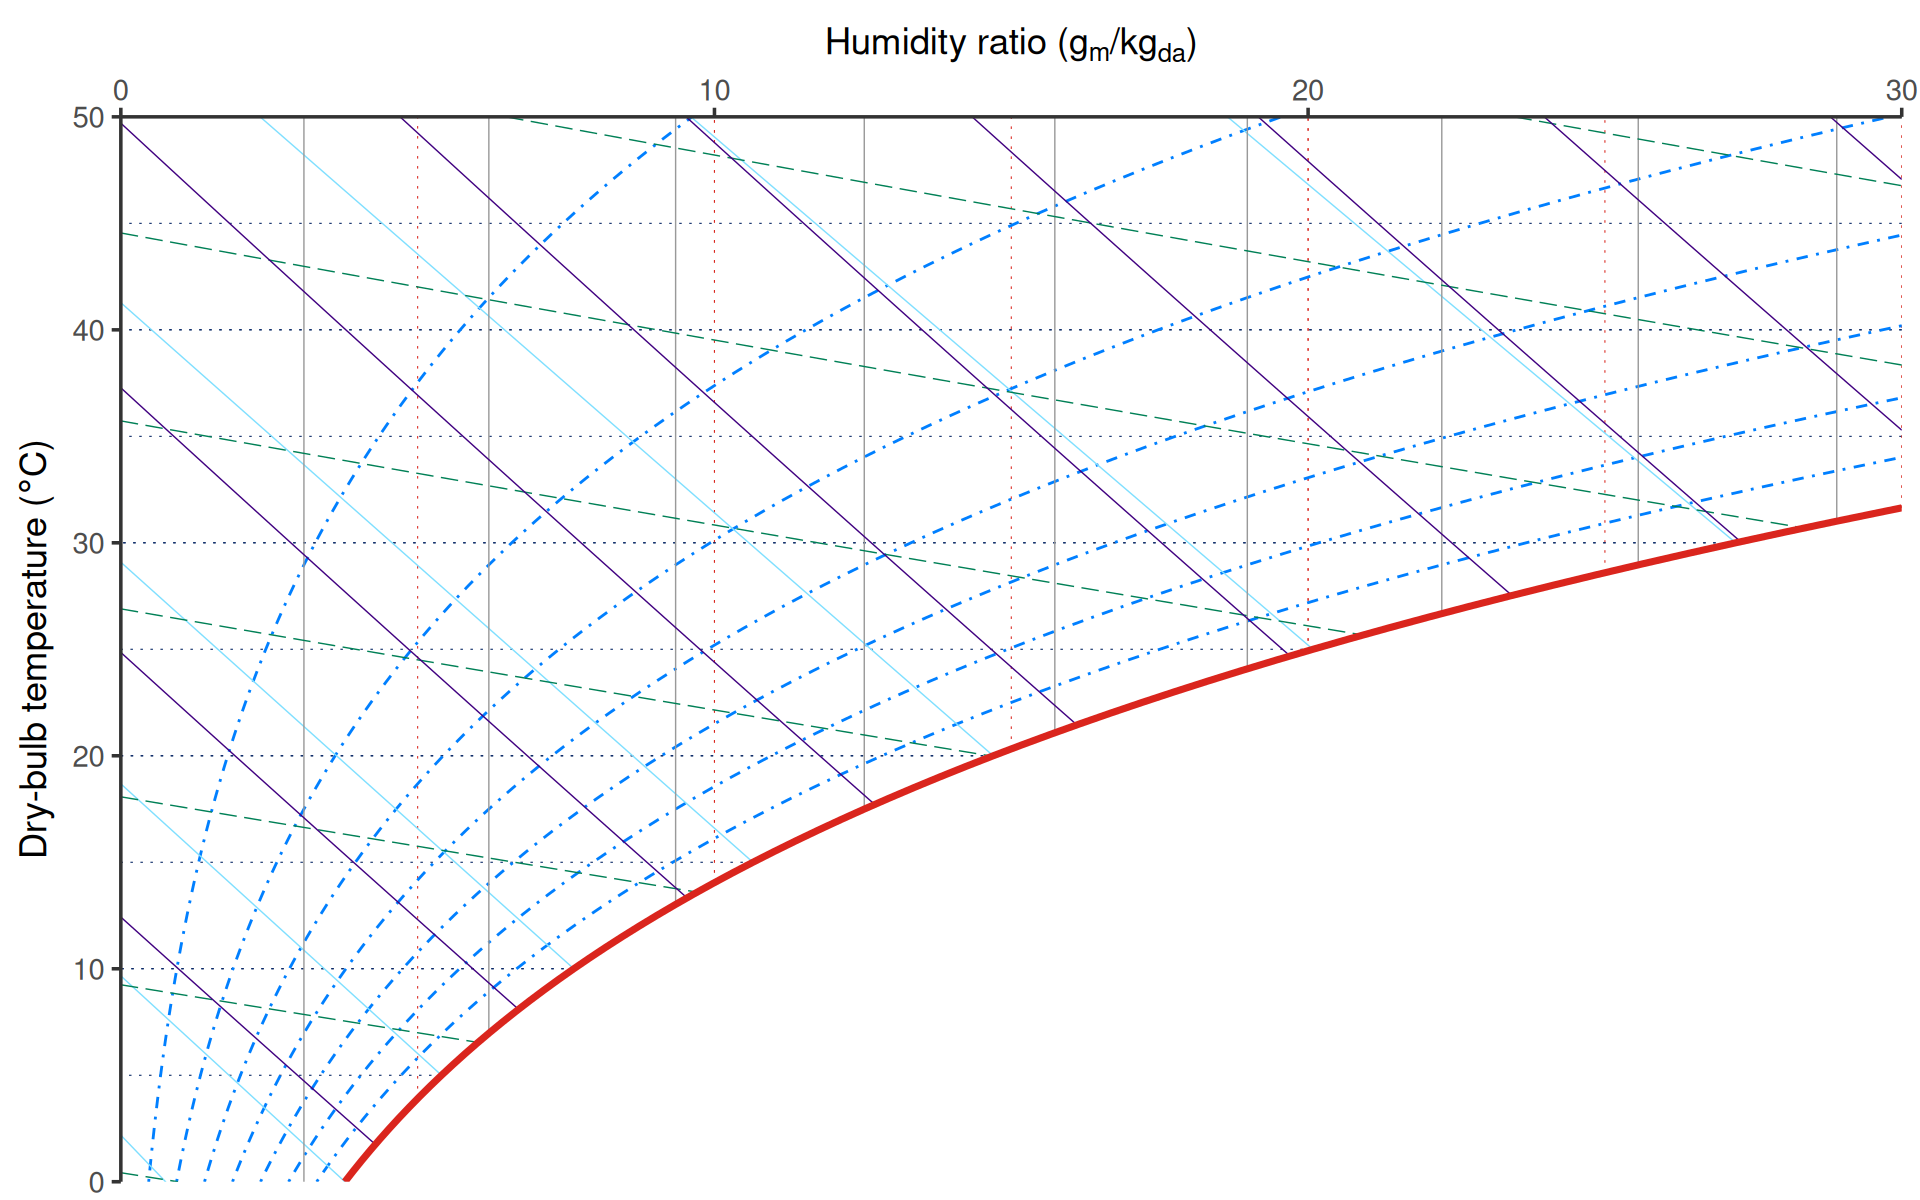
Explicit coordinates
ggpsychro() sets up the psychrometric coordinate system
for you. Most plots do not need an explicit coordinate call. Use
coord_psychro() when you need to replace or reconfigure the
coordinate system on an existing ggpsychro plot.
ggpsychro() +
    coord_psychro(tdb_lim = c(10, 35), hum_lim = c(0, 25), units = "SI")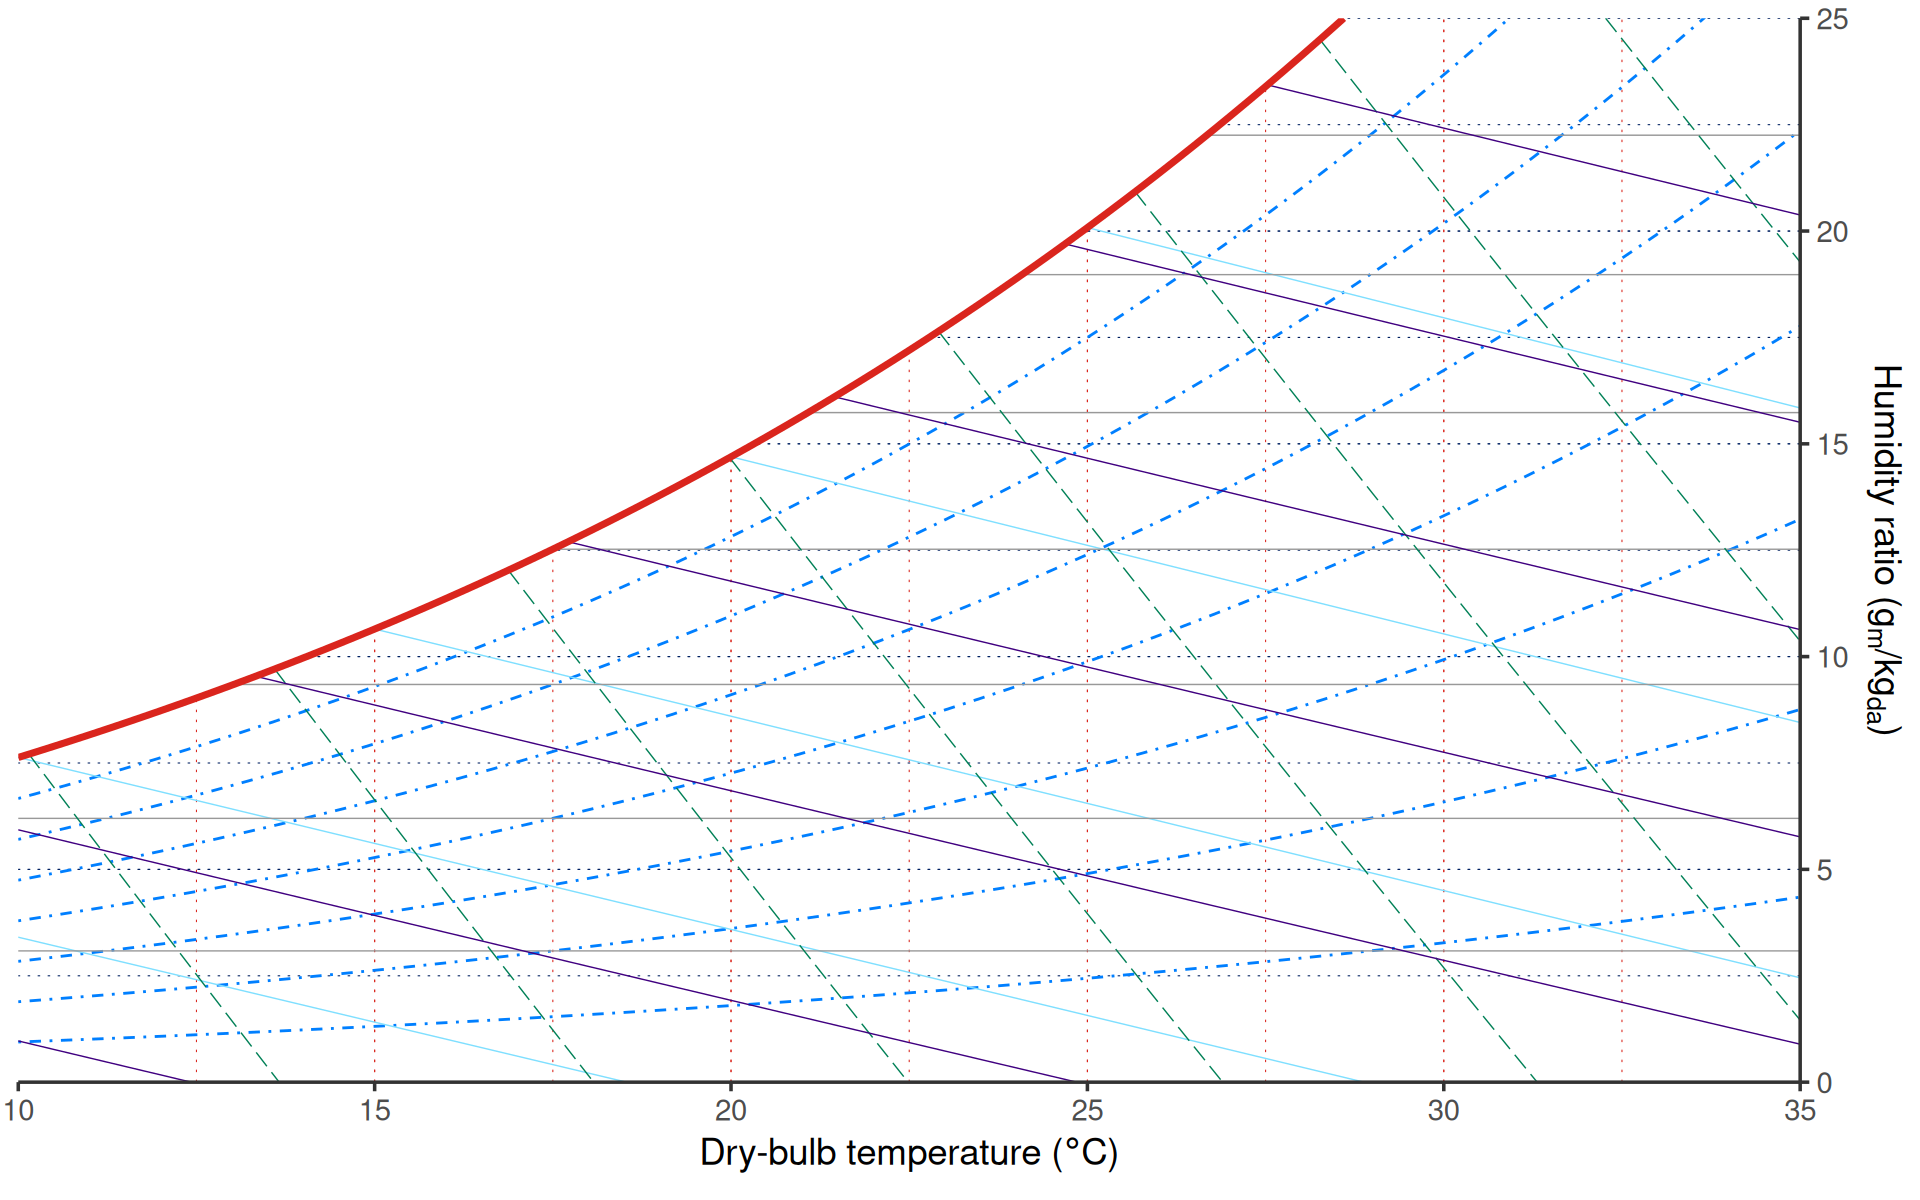
Add ggplot layers
Because the result is a ggplot object, regular ggplot layers work as usual.
states <- data.frame(
    dry_bulb_temperature = c(18, 23, 28, 31),
    humidity_ratio = c(8, 9.5, 10.5, 13)
)

ggpsychro(states, aes(dry_bulb_temperature, humidity_ratio),
    tdb_lim = c(0, 40), hum_lim = c(0, 25)
) +
    psychro_preset("minimal") +
    geom_point(color = "#0f766e", size = 2)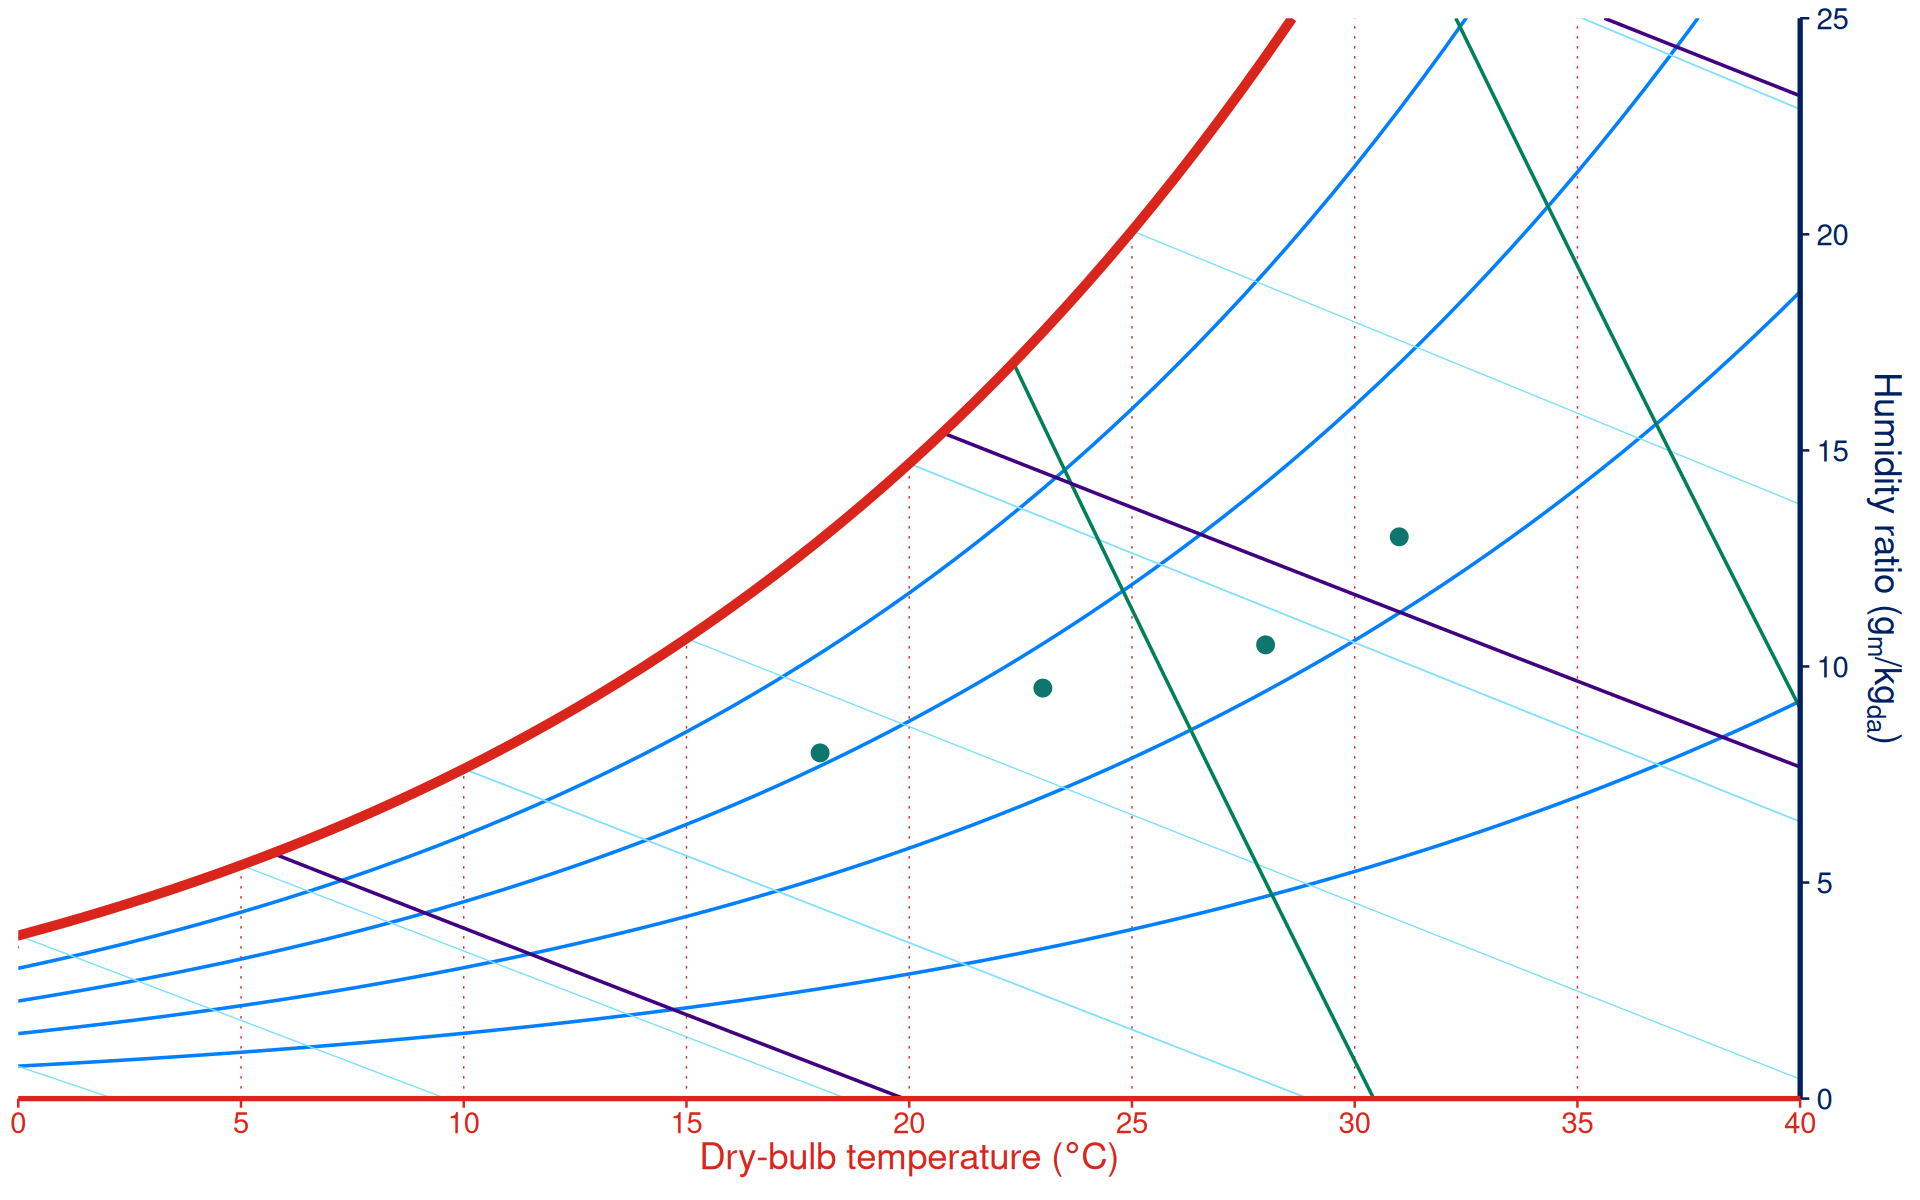
For data recorded as relative humidity, wet-bulb temperature, vapor pressure, specific volume, or enthalpy, see Plotting psychrometric data.