ggpsychro() creates a ggplot object configured for psychrometric charts.
It stores chart metadata, installs coord_psychro(), applies default axis
labels, and adds theme_psychro() so psychrometric grids, states, zones, and
comfort overlays can be added with the usual ggplot2 + workflow.
Usage
ggpsychro(
  data = NULL,
  mapping = aes(),
  tdb_lim = NULL,
  hum_lim = NULL,
  altitude = 0L,
  units = "SI",
  mollier = FALSE
)
Arguments
- data
Default dataset to use for plot. If not already a data.frame, will be converted to one by
ggplot2::fortify(). If not specified, must be supplied in each layer added to the plot.- mapping
Default list of aesthetic mappings to use for plot. If not specified, must be supplied in each layer added to the plot.
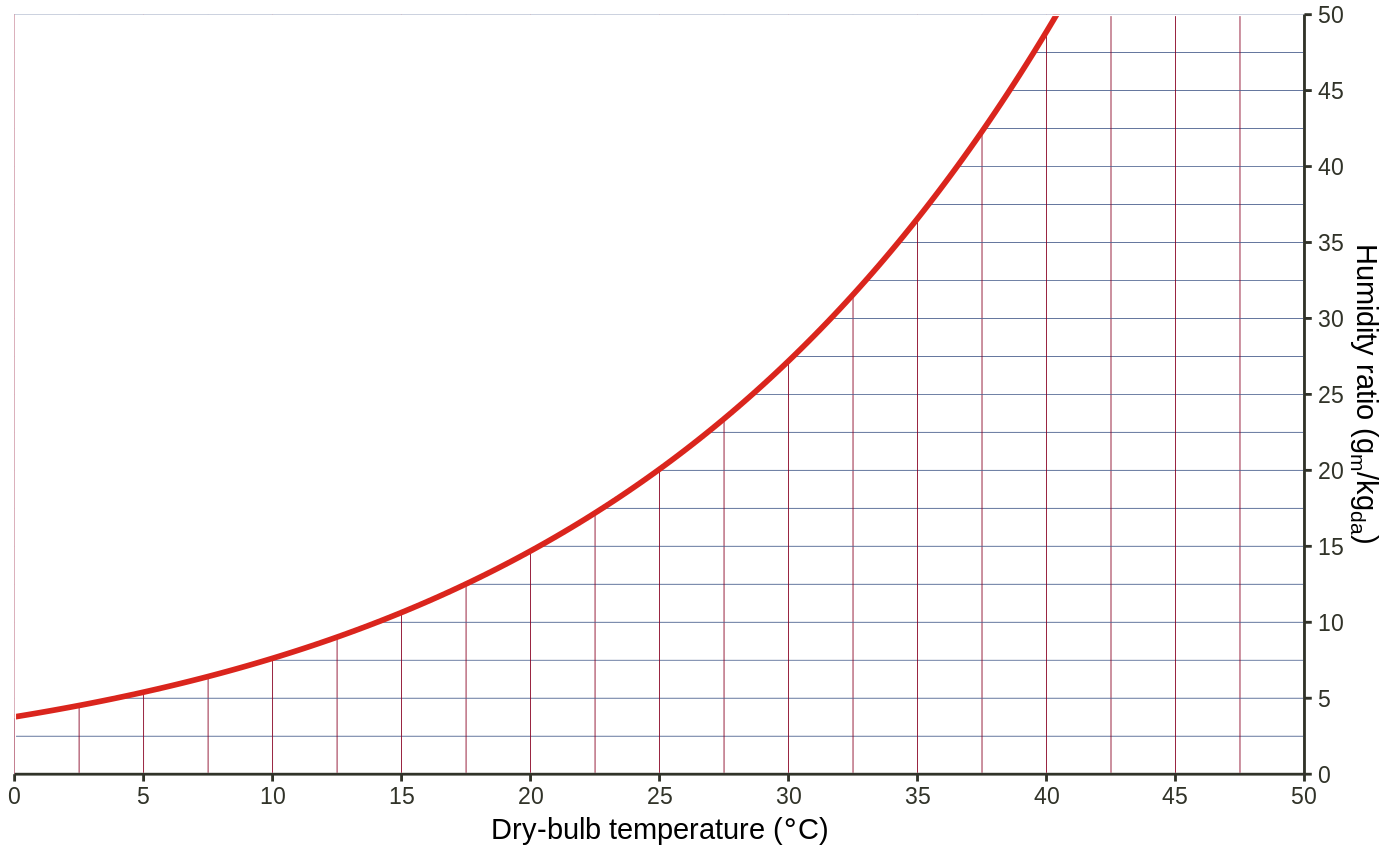
- tdb_lim
A numeric vector of length-2 indicating the dry-bulb temperature limits. Should be in range
[-50, 100]degrees C [SI] or[-58, 212]degrees F [IP]. IfNULL, trained data ranges will be used when available, otherwise a default display range will be used. Default:NULL.- hum_lim
A numeric vector of length-2 indicating the humidity ratio limits. Should be in range
[0, 60]g H2O per kg dry air [SI] or[0, 420]grains H2O per lb dry air [IP]. IfNULL, trained data ranges will be used when available, otherwise a default display range will be used. Default:NULL.- altitude
A single number of altitude in m [SI] or ft [IP]. Default:
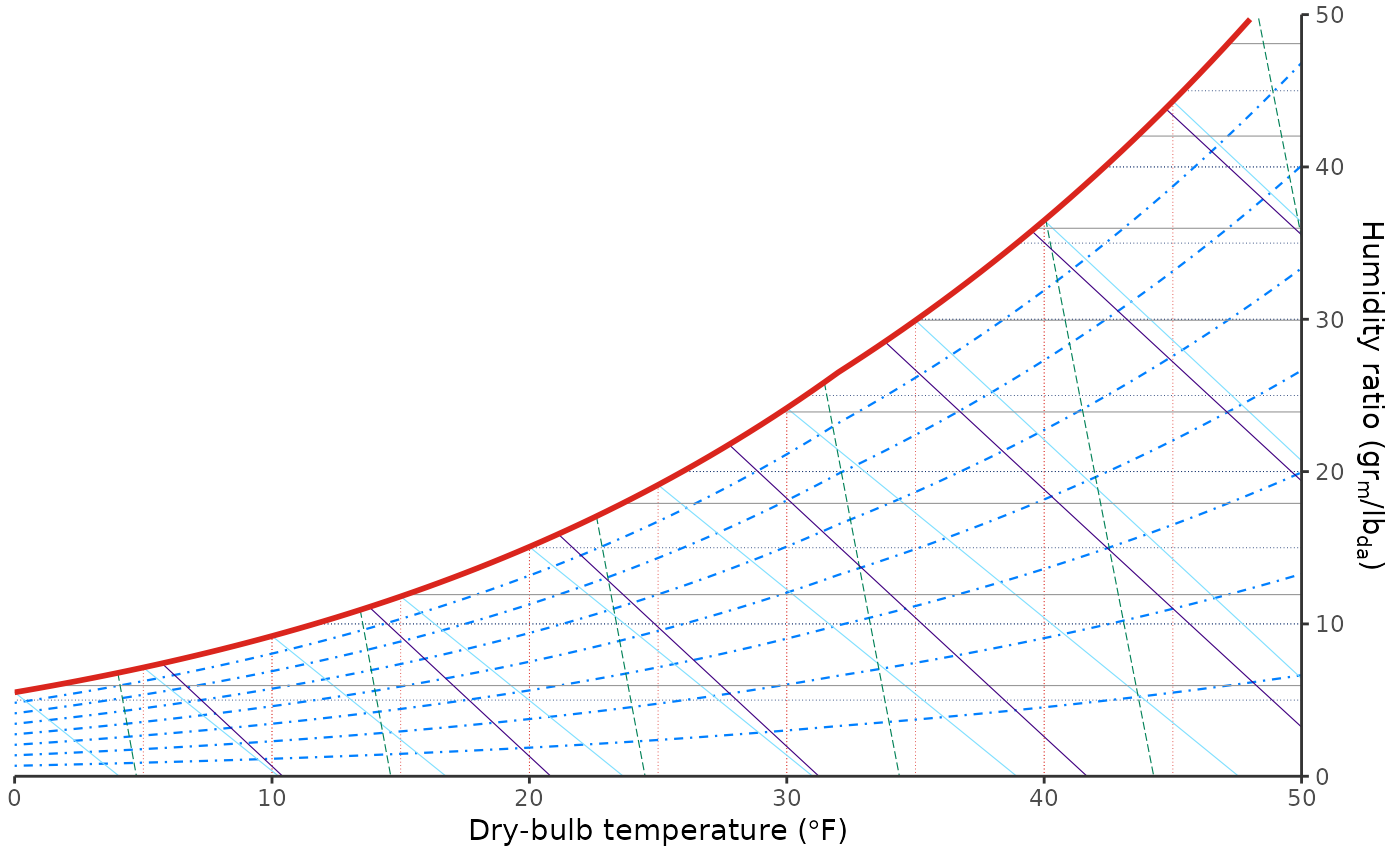
0.- units
A string indicating the system of units chosen. Should be either
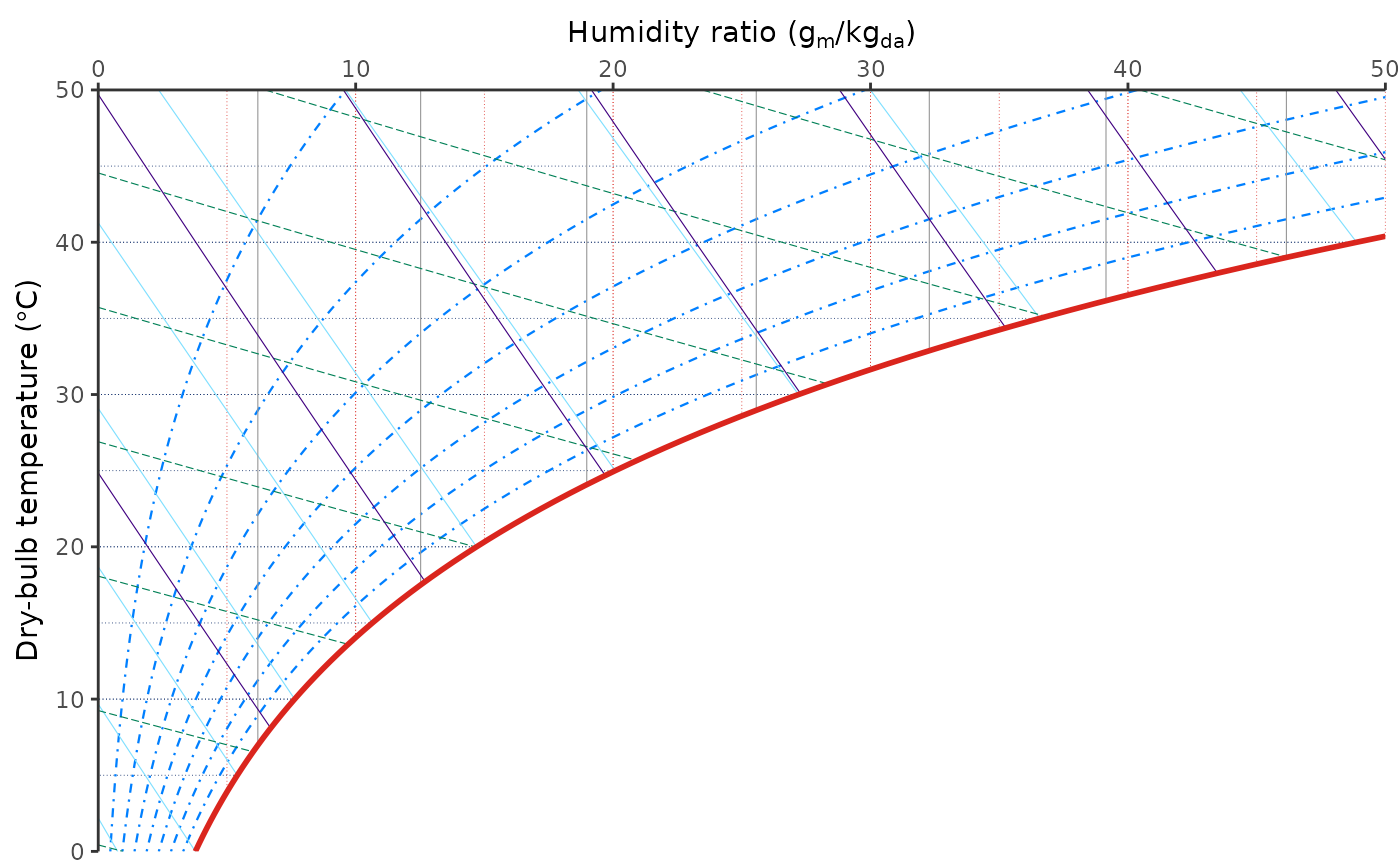
"SI"or"IP".- mollier
If
TRUE, a Mollier chart will be created instead of a psychrometric chart. Default:FALSE.