Advanced psychrometric coordinates
Usage
coord_psychro(
  tdb_lim = NULL,
  hum_lim = NULL,
  altitude = NULL,
  units = NULL,
  mollier = NULL,
  expand = FALSE,
  default = TRUE,
  clip = "on"
)
Arguments
- tdb_lim
A numeric vector of length-2 indicating the dry-bulb temperature limits. Should be in range
[-50, 100]degrees C [SI] or[-58, 212]degrees F [IP]. IfNULL, trained data ranges will be used when available, otherwise a default display range will be used. Default:NULL.- hum_lim
A numeric vector of length-2 indicating the humidity ratio limits. Should be in range
[0, 60]g H2O per kg dry air [SI] or[0, 420]grains H2O per lb dry air [IP]. IfNULL, trained data ranges will be used when available, otherwise a default display range will be used. Default:NULL.- altitude
A single number of altitude in m [SI] or ft [IP]. If
NULL, inherits the altitude from the parentggpsychro()plot.- units
Unit system, either
"SI"or"IP". IfNULL, inherits the unit system from the parentggpsychro()plot.- mollier
If
TRUE, use Mollier chart coordinates. IfNULL, inherits the chart type from the parentggpsychro()plot.- expand
If
TRUE, add a small expansion factor to the limits. Defaults toFALSEfor psychrometric charts.- default
Is this the default coordinate system? Defaults to
TRUEso replacing the coordinate system created byggpsychro()does not emit a ggplot2 replacement message.- clip
Should drawing be clipped to the extent of the plot panel? A setting of
"on"(the default) means yes, and a setting of"off"means no. In most cases, the default of"on"should not be changed, as settingclip = "off"can cause unexpected results. It allows drawing of data points anywhere on the plot, including in the plot margins. If limits are set viaxlimandylimand some data points fall outside those limits, then those data points may show up in places such as the axes, the legend, the plot title, or the plot margins.
Details
Most plots should start with ggpsychro(), which installs this coordinate
system and the matching psychrometric metadata for you. Call
coord_psychro() directly only when you are replacing or configuring the
coordinate system on an existing ggpsychro plot. When altitude, units, or
mollier is NULL, the value is inherited from the parent plot. Supply these
arguments explicitly when using the coordinate system outside that path.
Examples
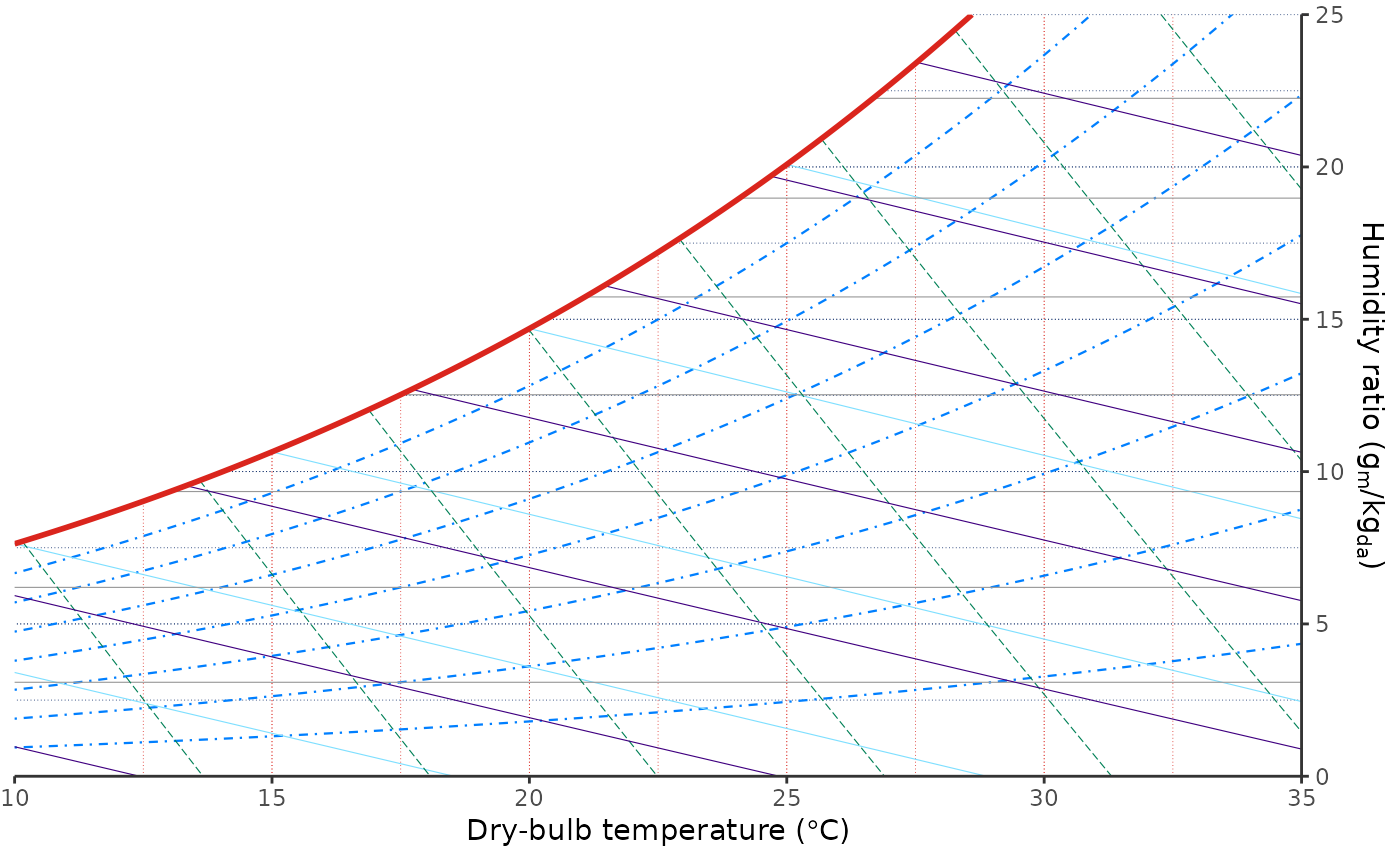
ggpsychro() +
coord_psychro(tdb_lim = c(10, 35), hum_lim = c(0, 25))
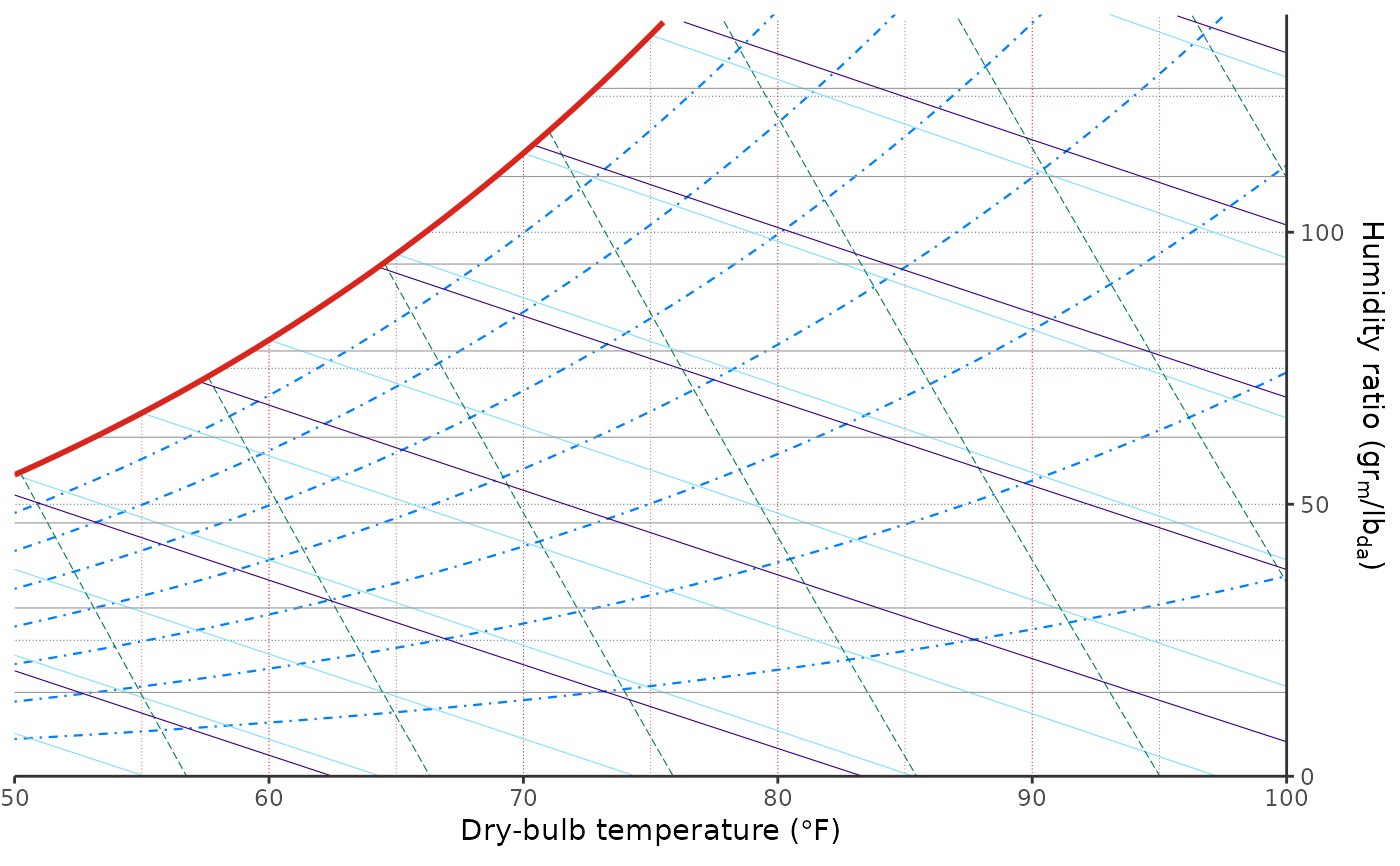
 ggpsychro(units = "IP", altitude = 1000) +
coord_psychro(
tdb_lim = c(50, 100),
hum_lim = c(0, 140),
units = "IP",
altitude = 1000
)
ggpsychro(units = "IP", altitude = 1000) +
coord_psychro(
tdb_lim = c(50, 100),
hum_lim = c(0, 140),
units = "IP",
altitude = 1000
)
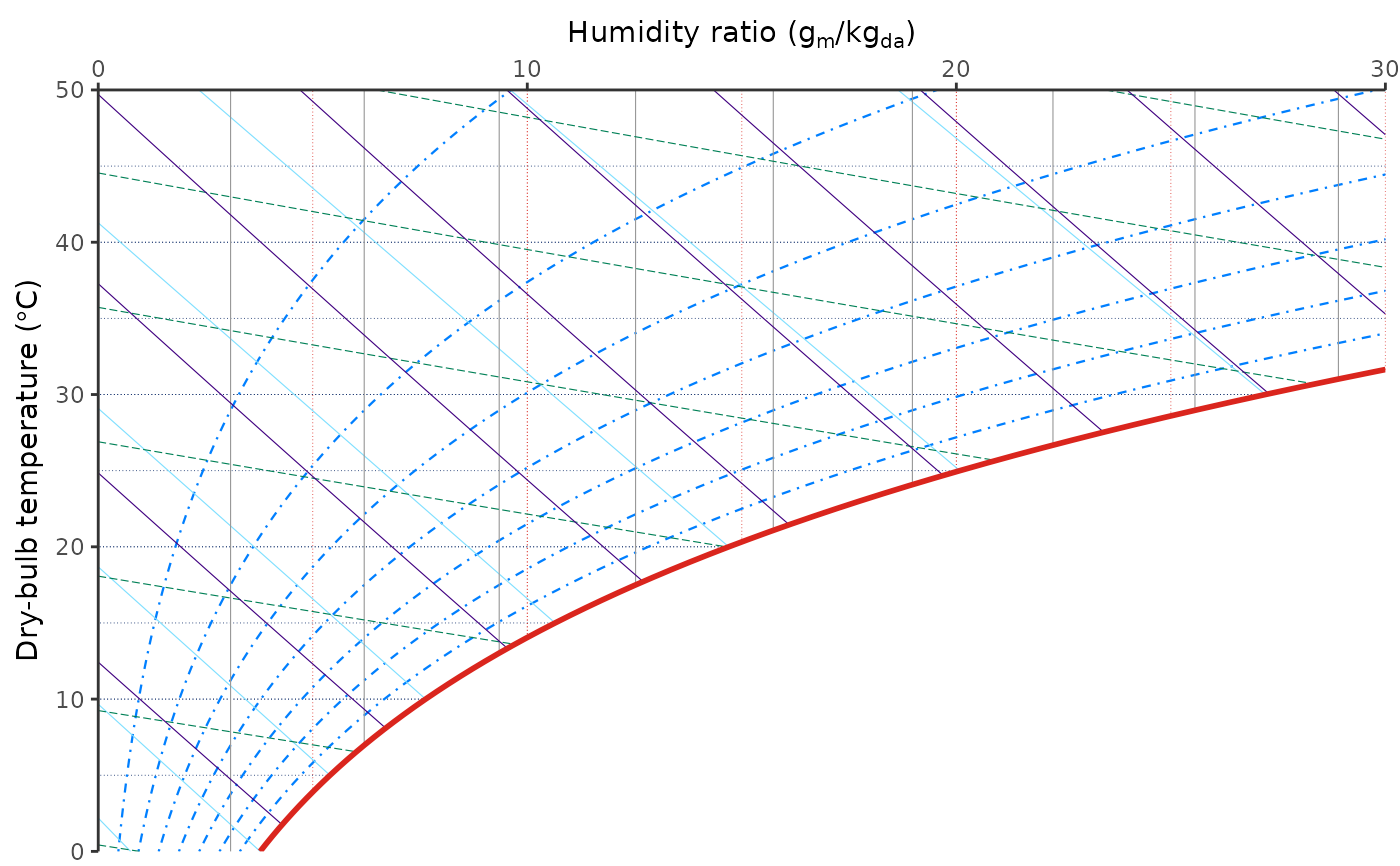
 ggpsychro(mollier = TRUE) +
coord_psychro(
tdb_lim = c(0, 50),
hum_lim = c(0, 30),
mollier = TRUE
)
ggpsychro(mollier = TRUE) +
coord_psychro(
tdb_lim = c(0, 50),
hum_lim = c(0, 30),
mollier = TRUE
)